Global oil industry overview
Based on 2015 results, the global hydrocabron liquids (HL) demand1 reached 94.4 mm bbl / day with 34 % of the global demand concentrated in Asia. According to IEA, the growth rates of global HL demand in 2015 increased by 1.7 % YOY versus 1.0 % YOY in 2014. The demand was mainly supported by Asian countries and predominantly by China, which accounted for 36 % of global HL demand increase in 2015.
According to IEA, the global HL2 supply in 2015 amounted to 96.4 mm bbl / day which was 2.8 % above 2014 level. A significant increase in hydrocarbon production worldwide in 2015 was driven by the exponential investment growth driven by high oil prices in 2011–2014.
About 47 % of the demand growth in 2015 was supported by growing production in OPEC countries. In particular, Saudi Arabia declared its intent to increase its own market share and raised its crude oil production (without gas condensate and other liquefied gases) to 10.1 mm bbl / day (+6 % YOY). Furthermore, the United States significantly contributed to an increase in the global supply with duction in 2015 reaching 9.4 mm bbl/day (+8 % YOY) driven by the perceptible growth of shale oil production.
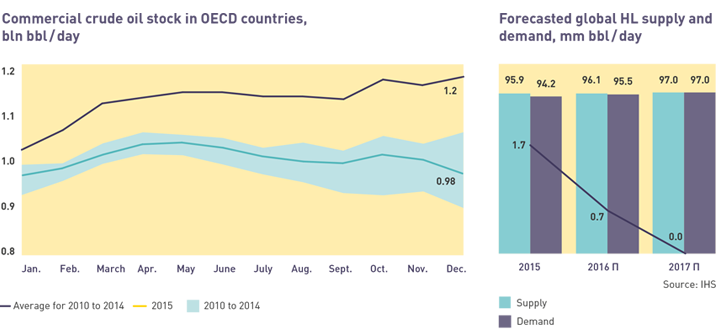
As a result, IEA reported an even higher gap between the global supply and demand in the oil market in 2015 with the supply being 2 mm bbl / day above the demand which resulted in a 22 % growth of commercial crude oil stock in ОECD countries to 1.2 billion barrels versus the average indicator between 2010 and 2014. The United States accounted for over 57 % increase in commercial stock in OECD countries in 2015. As of January 1, 2015, U. S. commercial inventories reached 482 mm bbl, which was 26 % higher YOY4.
IHS forecasts an increase in the global HL5 demand to 95.5 mm bbl / day (+1.3 % YOY) and to 97 mm bbl / day (+1.6 % YOY) in 2016 and 2017, respectively.
Reduced investment of oil and gas companies in 2015 and announced investment cuts in 2016 will mean an insignificant increase in global HL supply to a mere 96.1 mm bbl / day (+0.2 % YOY) in 2016 and to 97 mm bbl / day (+0.9 % YOY) in 2017.
HL demand growth rates being exponential to HL supply will contribute to a gradual reduction in supply surplus in 2016 and a balance between the supply and demand in the global HL market in 2017.
According to IEA forecast, a long-term sustainable growth of the global hydrocarbon liquids demand can be expected by 2030 with average annual growth rates of about 0.6 %. In 2030, the share of HL and natural gas in the global energy consumption structure will be 28 % and 23 % respectively.
According to the current estimates global gas demand grew by 3.1 % in 2015 to make 3.5 tcm. Gas still shows the highest growth among fossil fuels due to growing availability of gas in the form of LNG among the rest, a good number of procurement sources and significant global explored resource potential. Position of many countries for tightening ecological standards, particularly related to СО2 discharge control also supports the market.
In general LNG market keeps advanced growth rates. In 2015 LNG market grew by 3.2% to 250 mmt. For the last 10 years export LNG supplies grew by 87 %, provided that export of pipeline gas showed only 6 % growth. This tendency shall maintain and LNG market shall show outstripping growth rates, as forecasted.
Despite growing demand, competition is accelerating among the suppliers. In the next few years an unprecedented number of LNG projects shall be put into operation. 14 new LNG plants with the total annual capacity of 127 mmt are scheduled for commissioning in 2016-2020. A considerable number of projects are currently expecting the relevant investment decisions. Still, growing competition and complicated conditions cooled down the market. The less efficient projects are postponed or delayed.
Enhanced usage of gas as motor fuel is another important trend, leading to increasing gas demand.
Entry into global gas markets is a long-term strategic goal of the Company.
Overview of the Russian Oil and Gas Industry
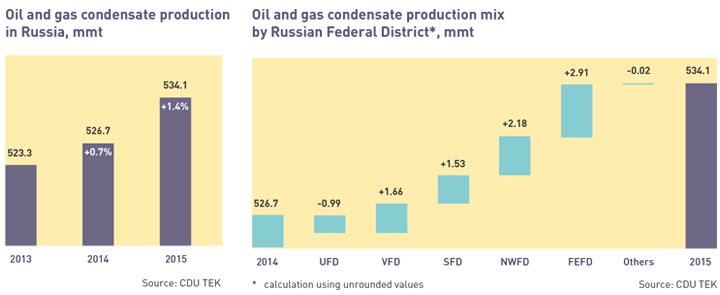
Oil and gas condensate production in Russia in 2015 reached 534.1 mmt, which was 1.4 % above the 2014 level. However, the national share in the global HL demand reduced insignificantly to 11.1 % versus 11.3 % in 2014. Lower oil production volumes in the Ural Federal District, a major producing region (56 % of the total production), was offset by higher oil production rates in the Volga (22 %), Siberian (9 %), Northwestern (6 %), and Far Eastern (5 %) Federal Districts.
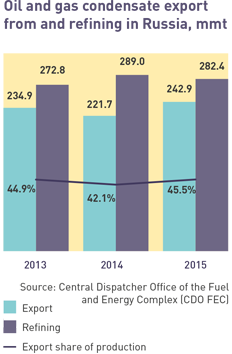
The “big tax maneuver” in the Russian oil industry made oil refining less appealing as compared to oil export in 2015. Despite growing production volumes, oil refining decreased by 2.3 % YOY to 282.4 mmt, while oil export increased by 9.6 % YOY to 242.9 mmt. Therefore, an average annual export share in oil production based on 2015 results increased to 4.5 %, being maximum during the last three years.